8th March 2010
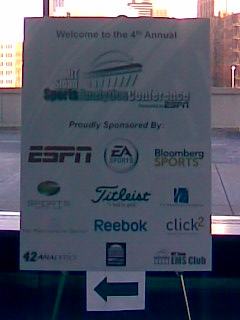 On Saturday, I had the distinct honor and privilege of attending the MIT Sloan Sports Analytics Conference in Boston, where a virtual "who's who" of basketball analysts were on hand to listen to panelists that ranged from Daryl Morey, Mark Cuban, and Kevin Pritchard to John Hollinger, Dean Oliver, and even Bill Simmons. It was such a great experience and a thrill to meet many of my fellow APBRmetricians, so here are some of my hoops-related impressions from the conference:
Read the rest of this entry »
Posted in General, Statgeekery | 14 Comments »
3rd March 2010
Who is the most dominant team in NBA history? That sounds like a straightforward enough question -- most fans would ask themselves which team "felt" the most dominant -- but if you want an objective answer, it's difficult to approach because "dominance" can be defined in a number of ways.
For instance, in his book "Dominance", Eddie Epstein wanted to answer this exact question for historical NFL teams, so he settled on a method of comparing each team's basic performance metrics (points scored/allowed & yards gained/allowed) to the league average and accounting for competitive balance by using Z-scores (standard deviations above avg.). This yielded a group of teams that you can't really argue with -- 1958 Colts, 1972 Dolphins, 1985 Bears, etc. -- but if we apply the same standard to NBA stats, we consistently end up with an interesting result at or near the top of the list:
Read the rest of this entry »
Posted in History, Statgeekery | 165 Comments »
3rd March 2010
On Monday I looked at the most competitive playoff series of all-time by the point differentials of the games, and I got some good feedback from readers about how to more accurately capture the "competitiveness index" of a series. Chief among the suggestions was what to do with overtime games, especially in light of the way Boston & Chicago's epic series last spring was perhaps being underrated by my initial metric. My favorite suggestion was that we simply count the point margin at the end of regulation time, which sets the margin of an OT game at 0 no matter what the final score was. I liked this because it was directly comparing apples to apples -- point differential at the end of regulation for both games that went into OT and games that didn't -- instead of forcing OT games to remain close for another 5 (or more) minutes. Also, I made the arbitrary choice to average raw point differential per game for each series rather than squared differentials, since it seemed like one blowout was being unfairly punished in an otherwise-close series. The results of these modifications are as follows:
Read the rest of this entry »
Posted in History, Statgeekery | 6 Comments »
1st March 2010
When the book closed on last year's Boston-Chicago first-round matchup, it was already hailed as one of the great playoff series of all time, as 4 of the 7 games went into overtime (including one game in double-OT and one in triple-OT!) and 5 were decided by 3 points or fewer. But while there's no doubt Celtics-Bulls 2009 was an instant classic and a great thrill ride, was it the most competitive playoff series ever? In fact, how would we measure "series competitiveness" anyway?
Read the rest of this entry »
Posted in History, Statgeekery | 15 Comments »
25th February 2010
Many NBA fans like to measure players by team accomplishments like wins and championships, perhaps because that is every team's ultimate goal before each season, and to a certain extent all players on teams that didn't win the championship have failed. With this in mind, I decided to compile a list of the greatest winners in NBA history (since 1952, at least) by taking the minute-weighted average of winning % and SRS for the teams they were on. Since we don't have game logs for players prior to 1986-87, this will serve as a reasonable proxy for what Dean Oliver calls "game by game winning percentages", or the team's W-L% when a player played for them. We'll break things up into 2 divisions -- small samples (those with at least 2,000 career MP but fewer than 10,000) and large samples (those with at least 10,000 career MP) -- and look at the best and worst players by career WPct and SRS. First, the top winning percentages:
Read the rest of this entry »
Posted in Data Dump, History, SRS, Statgeekery | 7 Comments »
19th February 2010
Yesterday I outlined a method for determining how similar the quality and arc of two players' careers were -- in case you missed it, the basic gist was that I minimized the sum of squared differences between year-by-year Win Share totals for any two players to find the best matches. I was surprised/overwhelmed by the response we got, so today I decided to take it a step further and try to match players' offensive and defensive Win Shares by age (instead of just total WS by season # of the player's career), which should give better matches than yesterday's method. Also, I felt old-school players were being shortchanged by a shorter schedule, so I pro-rated everyone's totals to 82 games, including this year's in-progress WS totals.
Read the rest of this entry »
Posted in History, Just For Fun, Statgeekery | 15 Comments »
18th February 2010
Two summers ago, Doug made a great post over at PFR that asked a simple question: Who is the current Dave Duerson? If you don't know who Duerson was, he was a good (4-time Pro Bowl) but not great (he won't make the Hall of Fame) safety for the Bears in the mid-1980s; seeing as I was born in December '85, I only know who he was because I've watched tapes of the 1985 Patriots and he was one of the Chicago defenders in that regrettable game that ended the Patties' season. Anyway, the point of the question was to find a bridge that related Doug's frame of reference (he was a huge sports fan by the time '85 rolled around) to that of someone my age who didn't compulsively watch old Patriots tapes and therefore wouldn't have any way of knowing who a semi-notable SS from 1985 was.
Read the rest of this entry »
Posted in History, Just For Fun, Statgeekery | 21 Comments »
16th February 2010
Last week, I made a post comparing 3-point shooting rates in the All-Star Weekend 3-Point Shootout to the participants' rates during the season. I found that contest shooters have made 3,669 of 7,173 shots (51.2%) in the contest over the years, and if you weighted their in-season 3FG% by their contest attempts, their usual season % is 40.5%.
However, longtime commenter Jason J noted that in a way, the 51.2% figure is artificially inflated by the fact that the best contest shooters will have the most attempts -- guys that get 10 points in the first round aren't equally weighted as guys that get 20, simply because the 20-point guy will move on to Round 2.
Read the rest of this entry »
Posted in All-Star Game, Statgeekery | 8 Comments »
9th February 2010
Yesterday, I laid out a scenario which could be an unforeseen consequence of a new CBA which limited contract lengths and imposed a hard cap -- namely, that if a player with all-time-great type ability (let's call him "Jim LeBaron") was sufficiently motivated to chase rings at the expense of everything else, the incentive to keep him in one place for a long-term would be removed and he could conceivably ink a never-ending Tim Wakefield-esque string of one-year contracts with the top contender who had the cap room to sign him. Today, I'm going to run a program I built to simulate this scenario, and see how many titles Jim The Ring Vulture would grab on average.
Read the rest of this entry »
Posted in Insane ideas, Statgeekery | 18 Comments »
8th February 2010
Labor issues abound as we head into the week of the NBA's biggest party, with the Commissioner reportedly presenting to the union a proposed CBA that would drastically reduce the players' share of basketball-related income, kill the Larry Bird exception, and severely limit long-term contracts & guaranteed salaries -- including existing deals! Understandably, NBAPA reps are miffed (Adonal Foyle called the proposal "rash", "unfair", and "ludicrous") but one effect of the new NBA financial landscape could be a generation of mercenary players who sign short contracts and hop from city to city, seeking max money and/or rings. Or at least that's how Bill Simmons saw it in his last mailbag:
"Q: Imagine if LeBron started a complete new trend starting in 2010 where he just decided, "Eff it, I'm winning a ring EVERY year" and signed one-year contracts EVERY YEAR for the biggest contender with cap space that could afford him. In true LeBron style, he begins a completely new type of superstar -- the "Superstar Hitman." It's as if we could have the 2010 LeBron sweepstakes EVERY YEAR! Can you imagine?
--Chris S., Brisbane, Australia
SG: Don't laugh -- you might see a modified version of that. One of two things will happen with the NBA's next collective bargaining agreement: Either they'll have a harder cap with no luxury tax (like what happened with hockey), or they'll change it so that no contract can be guaranteed for more than three years. I'd wager on the latter idea because it protects the teams from themselves as well as one deal crippling them -- like Elton Brand with the Sixers right now -- and swings things a little more in their favor. (For instance, you could sign Amare Stoudemire to a six-year-max deal this summer knowing that, if things go wrong for whatever reason, you have an out after three.) But if it goes this way, and I think it will, LeBron would never have to sign more than a three-year deal anyway. So he could play for the Bulls for three years, then the Lakers from 2013 to 2016, then the Knicks from 2016 to 2019, then back to the Cavs to finish things out. The ultimate gun for hire."
Over the next few days, I'm going to create a simulation of this very scenario, where one transcendent, LeBron-esque 26-year-old free agent decides to go for a title every year by hopping onto one of the league's 5 best teams. How many rings would he win? What if he could only do it every 3 years? What if he stayed in his original location? These are all the kinds of crazy scenarios I'll be playing out, Monte Carlo-style, and if you have more bizarre, unintended consequences of a new CBA to ponder, suggest them down in the comments and I'll see what I can do.
Posted in Insane ideas, Statgeekery | 2 Comments »
