7th July 2010
Last week I looked at the possibility of a LeBron James-Dwyane Wade "Big Two", as well as a James-Wade-Chris Bosh "Big Three", and now it looks like a Bosh-Wade combo is going to happen at the very least (whether it includes LeBron or not is still an open question). Wade & Bosh combined for 63.3 % of their teams' possessions last season, so let's look at other newly-formed Wing/Big combos from the past to see if they're the highest-usage inside-outside duo ever put together.
The rules:
- The combo must consist of 1 "Big" (C, PF) and 1 "Wing" (SG, SF).
- The combo had to play at least 500 minutes during both the season in question and the year before.
- The combo must include at least 1 player who wasn't on the team the year before.
Read the rest of this entry »
Posted in Analysis, Offseason, Statgeekery, Win Shares | 18 Comments »
2nd July 2010
As I watched Byron Scott's introductory press conference as head coach of the Cavs, the spectre of LeBron James' free agency hung over the proceedings (and justifiably so). Scott is a fine coach and has been successful in New Jersey & New Orleans, but I wonder what he could possibly be getting himself into -- I mean, Brian Shaw was reportedly Cleveland's first choice, but in the end he couldn't commit to the team without knowing James would be back. That's looking like a smart move, because now the unenviable question facing Scott is this: if James is gone, can the Cavs even be close to competitive without The King?
Read the rest of this entry »
Posted in Analysis, Offseason, Statgeekery, Statistical +/-, Win Shares | 8 Comments »
1st July 2010
Following up on yesterday's post about newly-formed "Big Twos", here are notable "Big Threes" from throughout NBA history, formed by taking at least 1 established star from another team. Just to be clear, this is not a list of the Greatest Big Threes Ever; rather, this is a list of combinations featuring players who had been the biggest focal points of their teams the previous year, and then were put together on one team, with each having to adjust to not being the clear-cut alpha dog anymore. Let's go to the list: (note that none of these would even come close to matching the 97.3% combined possession rate the proposed LeBron James-Dwyane Wade-Chris Bosh trio had in 2009-10)
1. Michael Jordan, Jerry Stackhouse, & Larry Hughes, 2003 Wizards
Previous Combined %Poss: 89.6% (Jordan - 34.6%; Stackhouse - 32.1%; Hughes - 22.9%)
Previous Team Offensive Rating: 104.8
New Team Offensive Rating: 103.0
New Split of Possessions: 27% (Jordan) - 27% (Stackhouse) - 21% (Hughes)
Comparability to James-Wade-Bosh: Low. We touched on this one yesterday, but it's tough to remember that Larry Hughes was also added to that Wizards team after being the primary facilitator on a Warriors squad that won just 21 games in 2002. The raw talent was certainly there for this group, but they were in the wrong place at the wrong time -- Jordan had peaked 5-10 years earlier, Hughes wouldn't peak until 2 years later, and Stack was what he always was, a high-volume/low-efficiency gunner.
Read the rest of this entry »
Posted in Analysis, Offseason, Statgeekery | 24 Comments »
29th June 2010
There's a good discussion brewing in the comments of yesterday's thread, centering on whether the big disparity in FTA between L.A. and Boston during the NBA Finals was something we could have expected based on the two teams' season-long tendencies. Here are the facts we know right now:
- Los Angeles received far more free throw attempts per shot in the immediate basket area than Boston did.
- Per possession, Boston was the 3rd-most foul-prone team in the NBA during the season; L.A. was the 2nd-least foul-prone team.
Basically, Boston fouled a lot more than L.A. during the Finals, but they also fouled a lot against everybody, and L.A. was a team that didn't foul much at all. The question is whether the disparity during the Finals was bigger than we would expect based on the teams' known fouling tendencies. Fortunately, I can estimate a team's expected fouls per possession and free throw attempts per possession by comparing their regular-season rates to the league-average and multiplying by their opponent's regular-season rates:
BOS Expected PF/Poss = ((BOS PF/Poss) / (Lg Avg PF/Poss)) * (LAL Opponent PF/Poss)
Read the rest of this entry »
Posted in Analysis, Playoffs, Statgeekery | 69 Comments »
23rd June 2010
Last year, Justin had a great series about the expected career and rookie-contract value (in Win Shares) of a draft choice by overall pick #, and it's a must-read this week as you prepare for Thursday's event. I don't want -- or need -- to tread the same ground here today; instead, I'm interested in what kind of peak performance you can expect out of a player drafted in each slot. Because as good as longevity is, I feel like a player's peak years say a lot about his overall talent level, and the type of production he's capable of putting up, even if he only did it for a brief time. There's an old saying in baseball: "Once a player displays a skill, he owns it." Peak performance is like that -- a guy like Penny Hardaway may have only been super-elite for 1 season before getting hurt and declining, but 1 season is all it took to show he had that type of innate talent.
Now, the question becomes, how do we measure peak performance? Justin already used WS, so I'm going to look at peak Statistical +/-, defined as the highest 3-year moving weighted average* of the player's career.
(* The average for Year Y was determined by regressing each season to 222 minutes of -2.57 +/-, and weighting the previous seasons like this: Y, 66%; Y-1, 22%; and Y-2, 12%. Players who never made the NBA were said to have peaked at -2.57.)
Here are the average peak performances for each draft slot from 1976-2000:
Read the rest of this entry »
Posted in Analysis, NBA Draft, Statgeekery, Statistical +/- | 13 Comments »
21st June 2010
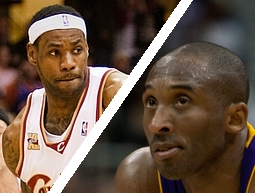 For those who missed the epic Kobe-LeBron thread over the weekend, here's a recap of a good back-and-forth between myself and a commenter named "Anon" (a far different Anon from the user who usually posts under that moniker, apparently)...
First off, I stated that if LeBron's teammates played as well vs. Boston as Kobe's did against the Celts, Cleveland would have advanced. In retrospect, I should have said "Cleveland would probably have advanced," since obviously there are no certainties, in life and least of all in sports, but the general point stands -- Cleveland's probability of beating Boston would have been higher had James' teammates given him a performance like Kobe's did against the same opponent. The justification for that statement is this:
"LeBron's SPM in the Cleveland-Boston series was +7.47. His team's efficiency differential was -5.8.
Kobe's SPM in the L.A.-Boston series was +7.45. His team's efficiency differential was +4.0.
Remember, 5 * the minute-weighted average of the SPMs of the individuals on a team must equal the team's efficiency differential.
This is what I mean when I say, 'if LeBron had gotten a Gasol-like performance from one of his teammates, Cleveland would have won.' Kobe and LeBron played at identical levels in their respective series vs. Boston. The only possible reason for their teams' disparate efficiency differentials must be the performances of their teammates."
I went on to show the cumulative stats for both teams during their respective series vs. Boston:
Read the rest of this entry »
Posted in Analysis, Playoffs, Statgeekery, Statistical +/- | 56 Comments »
17th June 2010
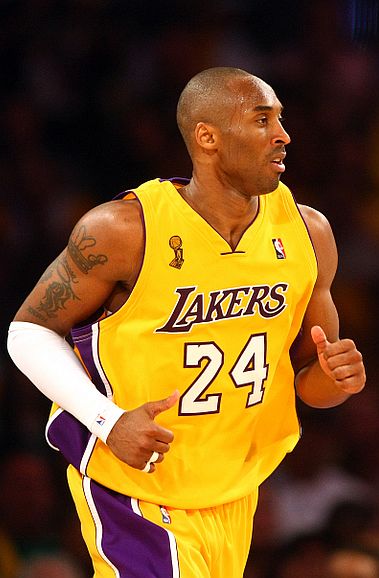 There's been a lot of talk about how Kobe Bryant's legacy is "on the line" tonight. Win, and he could become the Greatest Laker Ever™ (Bryant would have 5 championships in Forum Blue & Gold, tying him with Magic Johnson, Kareem Abdul-Jabbar and George Mikan as the franchise's winningest winner); lose, and it would be his 3rd Finals loss (clearly a blemish from which his reputation could never recover). In short, Bryant supposedly won't be the same caliber basketball player tomorrow morning if the Lakers don't win tonight.
In case you can't tell, I think that's an extremely flawed and childish way to look at the question of who the greatest Laker was/is. Kobe winning a ring tonight adds to his resume in some ways, but it's not like getting to 5 titles automatically ties his career with Magic Johnson's, nor is it true that he could never surpass Magic if L.A. loses tonight. Winning a ring is the ultimate team accomplishment, but we have much better ways to parse out player contributions than to lazily took at championship totals and blindly base our evaluations on them alone.
Read the rest of this entry »
Posted in Analysis, History, Statgeekery | 46 Comments »
17th June 2010
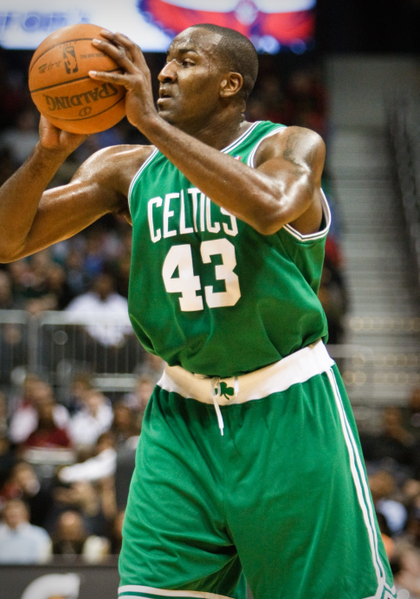 At first glance, Kendrick Perkins' knee injury early in Game 6 may seem like only a minor setback for the Boston Celtics -- after all, Perkins has scored just 8.5 PPG in the Big Three Era, and while his rebounding and defense are solid, he's never finished in the top 10 in RPG or garnered All-Defense honors. However, despite his lack of box score presence, Perkins has been highly important to the Celtics' chances this season: when he plays less than 22 minutes in a game, Boston is 5-8, including Tuesday's ugly loss and a similar beatdown suffered vs. Orlando in the Conference Finals when Perkins was limited by foul trouble.
We can really illustrate Perkins' hidden importance by looking at the Plus/Minus numbers. When Perkins was on the court for Boston this season, the Celtics outscored their opponents by 7.2 points per 100 possessions; when he wasn't playing, that number was only +0.2, a difference of -7 pts/100 poss. The same story has been true since Perkins became a regular starter in 2006-07: putting together a rudimentary game-by-game "with or without you" regression (similar to what I did in this post) between team HCA-adjusted PPG differential and whether or not a player played 17 minutes in the game (the MPG that usually indicates a "contributor"), Perkins shows up as adding +2.18 PPG to Boston's differential when he's a contributor vs. when he plays limited minutes or less.
Meanwhile, Perkins' Game 7 replacements, Rasheed Wallace and Glen Davis, don't fare nearly as well by the WOWOY metrics. Despite Davis' heroics in Game 4, he and Wallace have been Boston's two worst players by net on/off rating during the playoffs. Wallace has been particularly toxic for the Celtics all season -- the team played 5 pts/100 poss. worse when he was on the floor, as evidenced by his recurring appearance in the Celts' worst lineup combinations. Davis & Wallace look better by the 4-year WOWOY regression (Davis is +1.36, Wallace is +0.47), but neither has the ability to positively impact the game the way Perkins does. Without his presence, and playing on the road (home teams win Game 7 80% of the time), the Celtics appear to be in dire straits tonight.
Posted in Analysis, Playoffs, Statgeekery | 9 Comments »
16th June 2010
The Lakers needed to win last night to force a 7th game in the NBA Finals, and they didn't disappoint, delivering a brutal 89-67 beatdown that evened the series at 3 wins apiece. In NBA playoff history, this is the 105th series to go 7 games, and the 17th time the Finals have gone the distance. It should be a fitting finish to the season, and the capper to a thrilling 7-game Championship series with a razor-thin margin between the two teams...
Or has it really been that razor-thin? In the series, the Lakers have outscored the Celtics by 20 points after 6 games. Is that a lot, or a normal amount for a 7-game series? How does that compare to the margins of past 7-game playoff series through 6 games?
Read the rest of this entry »
Posted in Analysis, Playoffs, Statgeekery | 15 Comments »
15th June 2010
Last week, I took a look at Kobe Bryant's performance vs. the Boston Celtics in Games 1-3 of the Finals, and how it compared to his performance against them in 2008, as well as LeBron James' performance against them a month ago. With 2 more games having passed, it's time to update the numbers:
Read the rest of this entry »
Posted in Analysis, Playoffs, Statgeekery | 18 Comments »
