This is our old blog. It hasn't been active since 2011. Please see the link above for our current blog or click the logo above to see all of the great data and content on this site.
A few weeks ago, I looked at various players' career performances in "crucial games", which I defined as: "Game 3 or later in a 7-game series; Conference Semifinals or later; series tied, within 1 game either way, or an elimination game for the trailing team". But while that's a nice working definition, it's certainly far from universal; for instance, one commenter pointed out that an elimination game when down 3-0 isn't very "crucial" at all, because even if you win, it doesn't really do a lot to change the outcome of the series.
Now, I had been operating under the assumption that you still feel pressure as a player even when facing an insurmountable deficit (maybe you even feel the most pressure under those circumstances), but I can see where performing well in that kind of game doesn't really carry the same weight as the same performance in, say, a Game 7. It's a bit like that old criticism of Alex Rodriguez -- he only hits home runs when the score is lopsided (that isn't true, by the way, but it was an actual criticism they lobbed at A-Rod for a while before the Yankees won a World Series with him). A solo HR always counts for exactly 1 run, of course, but if you look at Win Probability Added, that HR can take on wildly different win values depending on the situation. The same goes for wins in a 7-game series -- winning Game 5 when it's tied 2-2 is more important than winning Game 5 when you're down 3-1.
In case you missed last night's game, Ray Allen went crazy from beyond the arc in the first half, knocking down his first seven 3-point shots of the contest. As Henry Abbott notes, Allen is a career 40% shooter from beyond the arc, on 6678 career attempts. So Henry asks:
"If you hit 40% of the time, and take 6,678 shots, how often would you end up with seven or more makes in a row?
Does Allen do that more often than you'd expect? (Bring on your probabilities!) If the answer is yes, then let's talk about the hot hand. But if the answer is no, well then let's appreciate this is the kind of night good shooters have sometimes, even without the supernatural."
Let's address the first question -- on average, how many runs of 7 straight 3-pointers would you expect a Ray Allen-like career (40% shooter, 6678 shots) to contain? And what's the probability that he would do it at least once in his career? Well, there's no easy way to set this up in equation form, because you have to account for the possibility of multiple sequences containing at least 7 consecutive makes, which would require some heavy-duty combinatorics. Instead, when confronted with a problem like this, I like to set up a Monte Carlo simulation and derive the probabilities by running a large number of trials (for other examples of posts where I did this, see here, here, here, here, and... well, you get the idea).
After last night's Laker rout, in which a foul-troubled Ray Allen only took the floor for 27 minutes, I wondered how important it was for the Celtics to have Allen play a substantial amount of time. Because while he may be the 3rd-best player on the team (4th-best if Garnett is anything like his vintage self), his ability to knock down huge threes has been indispensable to Boston over the past 3 years, especially in these playoffs.
To make a quick-and-dirty test on how important it was for Allen to play 30 or more minutes in a game, I created a sort of bastardized version of Adjusted Plus-Minus (using RS + playoff data in the "Big Three" era -- 2008-10) that predicts a team's homecourt-adjusted efficiency differential in every game based on whether or not any given player played at least 30 minutes or not in the game (a 48 minute game, that is -- the threshold was proportionally higher for OT games).
Today I have a mailbag question from our friend David Biderman at The Wall Street Journal:
Hey Neil,
I had an NBA playoffs question. I took a quick (really quick) glance at the Celtics, and the first thing that jumps out is how balanced their starting five was during the regular season. Is there any way to quantify how balanced a team is? If so, could we do this for NBA finals teams?
Absolutely; in fact, it's a concept I looked into a bit for these posts:
However, I hadn't looked at NBA Finalists in particular yet, and I also would like to take this opportunity and try out a new metric to measure how balanced teams' starting lineups are.
The new metric (well, new to me at least) is called the Herfindahl-Hirschman Index (HHI), which measures how concentrated a market is among its firms. A monopolistic market will have a high HHI score, indicating that the majority of the market power rests with only a select few firms; conversely, a lower HHI score indicates a competitive market in which all firms have relatively equal shares. If you think of a basketball team as a market, you can apply this logic to a 5-man unit -- every player is working together to create points, but they're also "competing" against each other for touches and shots. A "monopolistic" lineup would be one where only one or two players take the majority of the possessions (think the 2000-02 Lakers with Shaq & Kobe), while a "competitive" lineup would be one where the offensive chances are distributed relatively evenly among the 5 players on the court.
One of the biggest storylines of the 2010 playoffs has obviously been the Boston Celtics' totally unexpected postseason turnaround. From late December through the end of the regular season, the Celts were a very mediocre ballclub (literally average: they were .500 after Christmas), but in the playoffs they have looked -- and played -- like a completely different team, very nearly channeling the dominance of their 2008 championship squad. And lost amid the stories of Boston's playoff about-face has been the fact that the Lakers, owners of barely an above-average offense during the regular season, have morphed into an offensive juggernaut once again, as they were during the 2008 and 2009 regular seasons. In the history of the NBA, have any Finalists changed their identities more during the playoffs?
To answer that question, let's briefly go back to yesterday's post... There, I introduced a method of estimating team offensive and defensive ratings (points scored and allowed per 100 possessions) for years prior to 1974, which essentially opens up all of NBA history to us for studies like this (except 1951 -- unbelievably, they didn't even track rebounds that year). Today I want to use the same framework to see which Finalists most outperformed what we would have expected their playoff offensive & defensive ratings to be, given their regular-season numbers and the RS numbers of their playoff opponents.
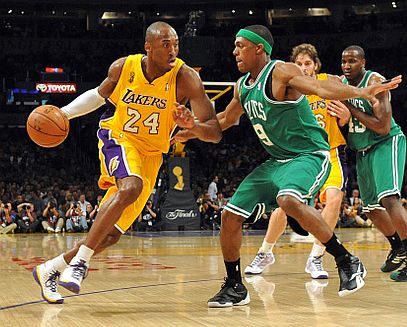
You might think the most similar Finals matchup to this week's upcoming Celtics-Lakers showdown is the one that took place between the same teams just two years ago. After all, most of the cast of characters is exactly the same as it was in '08, with the primary superficial differences being that Andrew Bynum is available for L.A. this time, Rajon Rondo has improved from a role player to a legit star for Boston, and Ron Artest was added to the Lakers in Trevor Ariza'sVladimir Radmanovic's place.
However, the 2010 versions of both teams are actually dramatically different from their '08 incarnations when you look at their offensive & defensive performances relative to the league. To study this, I wanted to look at how said performances stack up to those of past NBA Finalists, and what the most comparable historical matchup is to this year's Lakers-Celtics duel. In order to measure offensive and defensive efficiencies for teams that played before 1973-74 (when the league didn't track the necessary data to calculate possessions), I had to develop a way to estimate possessions used from the stats that were kept back to 1951 (before 1951, they didn't even track rebounds!). I found that the best formula to predict a team's possessions used from the basic team totals that existed going back to 1950-51 was this:
Yesterday, we had a discussion about Kobe Bryant's surprisingly Vince Carter-esque numbers in career "crucial" games (defined as a Conference Semifinal game or later; Game 3 or later; series tied, within 1 game either way, or an elimination game for the trailing team). A commenter brought up the possibility that Bryant had faced tougher defenses than other stars in his playoff career, so today I'm going to run the numbers for players since 1991 and see who actually has faced the toughest defenses in their playoff careers, first in all games, then just in "crucial" games.
Marv was at his best in that clip, practically lending biblical overtones to John Stockton's feats in Game 4, and I was so inspired by Albert's proclamation that Stock "seized the moment like few others in NBA history" that I wanted to find the players who had the best career performances in crucial games like that Game 4.
At the MIT Sloan Sports Analytics Conference in March, Mavs owner Mark Cuban remarked that he could tell which teams used advanced stats and which didn't simply by looking at who their most frequent lineups were. For instance, some teams put out combinations where Cuban said he understood why the coaches thought it would be good for the team, but the +/- numbers showed that the team was losing badly when that group was on the floor. So one way of evaluating coaches is to look at their most frequently-used lineups and see how they match up with a list of the team's most effective lineups by either adjusted +/- or, in the absence of that, raw +/-. Here's how the remaining four coaches (Alvin Gentry, Phil Jackson, Doc Rivers, & Stan Van Gundy) have been doing so far:
What is it about the Phoenix Suns and Staples Center this season? The Lakers are a good home team, having gone 34-7 with a +8.5 PPG differential in L.A. this season, so that's a big part of the explanation. But when Phoenix plays them there, their problems seem to go further than typical home-court advantage effects -- look at the difference between the Suns' Four Factors at Staples and at the US Airways Center:

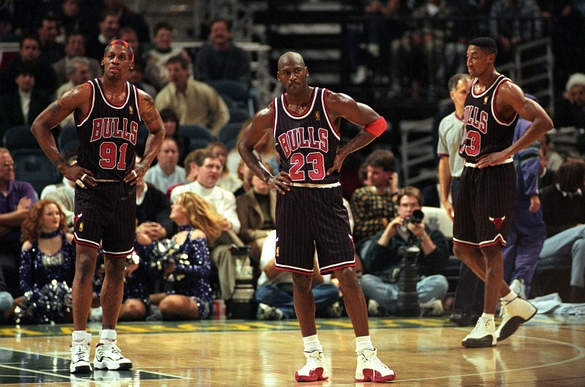 A few weeks ago, I looked at various players' career performances in "crucial games", which I defined as: "Game 3 or later in a 7-game series; Conference Semifinals or later; series tied, within 1 game either way, or an elimination game for the trailing team". But while that's a nice working definition, it's certainly far from universal; for instance, one commenter pointed out that an elimination game when down 3-0 isn't very "crucial" at all, because even if you win, it doesn't really do a lot to change the outcome of the series.
 In case you missed
  After
After 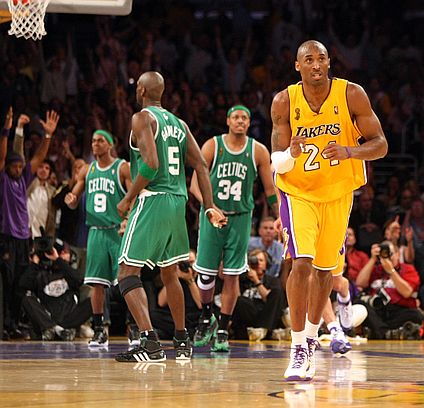 One of the biggest storylines of the 2010 playoffs has obviously been the
  You might think the most similar Finals matchup to
  At the