16th December 2009
 Whenever Hall of Fame arguments come up, especially in baseball, I have a tendency to tune out from the sheer tediousness of the typical debate. On one side, there's always an arrogant guy who saw many of Player X's games and "knows" he's a Hall of Famer, so he cites other, lesser players who are already in the Hall (as though that were somehow evidence Player X should be in), brings up a couple of memorable career moments, and generally fudges on borderline issues to make the player seem better than he actually was. On the opposing side, another equally narcissistic guy splits hairs about the "magic numbers" Player X failed to reach, denigrates his career because A) if he won titles, he didn't have enough individual honors; or B) if he had a lot of individual honors, he didn't win enough titles. Throw in a few unsubstantiated jabs at Player X's character and/or manhood, and then start the whole process over again -- how fun.
Read the rest of this entry »
Posted in Hall of Fame, History, Statgeekery, Statistical +/-, Win Shares | 35 Comments »
7th December 2009
 Continuing our series on huge playoff upsets, I've taken the methodology I laid out on Friday and applied it to every playoff series from 1991-2009 to determine the probability of each team winning, given the distribution of minutes for their players in the series. This is accomplished by finding weighted averages of the team's players' and opponents' seasonal SRS-SPM scores (see Part I for an explanation), and plugging them into the following equation to produce a single-game expected winning %:
xWP = 1 / (1 + exp(0.622 - 0.168(tm_srs) + 0.168(opp_srs) - 1.244(homecourt)))
Again, where homecourt = 1 if the team is at home and 0 if they're on the road. Armed with these single-game probabilities, all that's left is to use them to calculate the odds of winning a series of a given length with a given # of home games. This of course means you need to calculate not only the probability of each series outcome, but also the probability that the series ends in each specific # of games (for instance, winning a series in four games would require 4 consecutive wins -- WWWW -- while you could win in five games four different ways -- WWWLW, WWLWW, WLWWW, or LWWWW).
Read the rest of this entry »
Posted in Data Dump, History, Statgeekery, Statistical +/- | 18 Comments »
4th December 2009
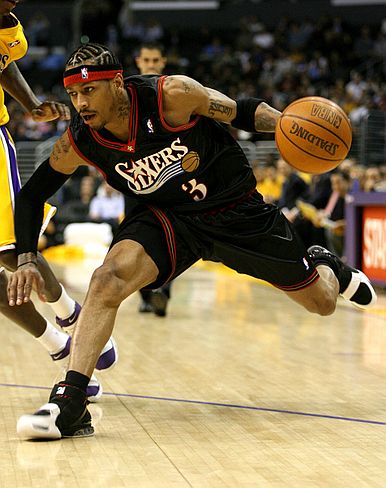 Back in the spring, I used Statistical Plus/Minus to predict individual playoff series outcomes (and to pretty decent effect, too -- I mean, yes, it did miss on Cleveland-Orlando, but then again so did just about everyone, including the bigwigs at Nike). Anyway, today I'm going to use a similar method to look back on every playoff game from 1991-2009 and see which games ended in the most unlikely outcomes.
Read the rest of this entry »
Posted in Analysis, Data Dump, History, Statgeekery, Statistical +/- | 9 Comments »
3rd December 2009
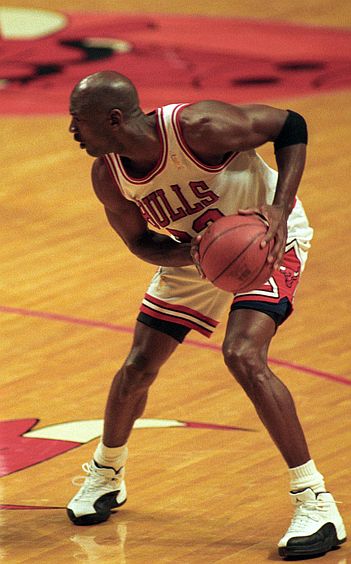 Yesterday I rolled out a very primitive idea for evaluating players by logically weighting their regular-season and postseason production. In case you missed it, I put everything in terms of the typical team's championship probability, and weighted regular-season and playoff Win Shares based on how much each type of win added to the probability of winning a title. I still think the core idea is terrific, but when the smoke cleared yesterday we came out with a list that saw old-school NBAers and ABA stars dominate over modern players -- I mean, Cliff Hagan ranked ahead of Michael Jordan, for goodness' sake! What in the name of Max Zaslofsky is going on here?
Read the rest of this entry »
Posted in Analysis, History, Statgeekery | 12 Comments »
2nd December 2009
 (Note: This method is in the very early stages, so I'm trying to generate some useful feedback more than anything else. Be warned that the results are very rough.)
If you're a regular visitor here at Basketball-Reference, I think it's pretty safe to say that you're interested in all-time player ranking arguments -- it's okay, I am too. We love to try to make order out of the chaos that is the history of pro basketball, and one of our chief means of doing that is putting together lists and rating players to see where they fit in the larger context of the game. In fact, that was the motivation behind this next series of posts, to try to put together some semblance of an objective player ranking, encompassing the entire Win Shares era (1951-52 to the present).
The main problem I've had with these types of all-time rankings in the past is this: how do you deal with the playoffs, in terms of weighting them against regular-season results? Many fans place a lot of value on the postseason, but without a lot of thought going into why, other than "Player X is clutch," or "I think titles matter the most because as a fan I want my team to win them, so I'll rank Player Y higher than Player Z because he has more rings". What I want to determine, though, is an objective way of valuing the playoffs vs. the regular season, so we can achieve what I'm going to call "Championship Probability Added", or the amount by which a player increased his team's chances of winning a title through his Win Shares.
Read the rest of this entry »
Posted in Analysis, History, Statgeekery | 15 Comments »
28th November 2009
Here's a really interesting development on the adjusted plus-minus front... Hoopnumbers, whose work with APM has been noted by us in the past, now has 3-year weighted APM scores for 2008-09 that break down every player's impact in each of Dean Oliver's Four Factors on both offense and defense. So now you can finally see that, for instance, Steve Nash increased his team's effective FG% more than any other player, or that Trevor Ariza was the best at increasing the opponent's rate of turnovers per possession. Very cool stuff.
Posted in Layups, Statgeekery | 1 Comment »
9th November 2009
In case you're a hoops fan that's been living under a rock these past 6 years, 82games is the web destination for NBA game-tracking data, including plus/minus, counterpart stats, and a variety of other incredible numbers that you can't find anywhere else. Today Roland Beech released the 2009-10 stats pages, so head over and just bask in the raw data. Bask in it!!
Posted in Layups, Statgeekery | 5 Comments »
4th November 2009
Hoopnumbers.com has debuted a method of calculating adjusted +/- with the lowest standard errors yet. If you want the gory mathematical details, go here and here first, but if you just want the results, check out the 3-year version and the single-year 2008-09 results... A (very) brief synopsis: Kevin Garnett and Lamar Odom? They're really good. Josh Powell and Antonio Daniels? Er, not so much.
Posted in Layups, Statgeekery | 8 Comments »
14th October 2009
Quick question: What's the probability that the league's "best" team will win the championship this season? Okay, then what are the odds that a team outside the top 5 in talent will win it all? Outside the top 10? The top 15?
Read the rest of this entry »
Posted in Season Preview, Statgeekery | 5 Comments »
9th October 2009
Last November, we used Win Shares to look back at the players who took the floor alongside the most talented offensive players over the course of their careers. Unfortunately, in that article I only looked at offensive teammate quality, and we only had Win Shares going back to the 1973-74 season. Today, though, Justin's efforts have given us WS extending back to every season for which the NBA tracked minutes (through 1951-52, in case you were wondering). So I thought now would be as good a time as any to revisit the topic of teammate quality using offensive, defensive, and total Win Shares since 1952.
Read the rest of this entry »
Posted in History, Statgeekery, Win Shares | 7 Comments »
