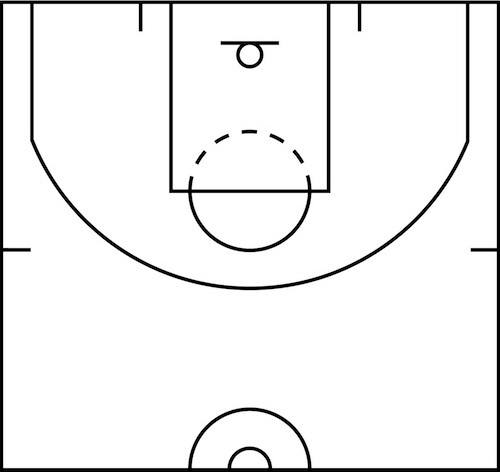
Orlando Magic Table
| Qtr |
FG |
FGA |
FG% |
2P |
2PA |
2P% |
3P |
3PA |
3P% |
eFG% |
Ast'd |
%Ast'd |
| 1st | 13 | 21 | .619 | 13 | 20 | .650 | 0 | 1 | .000 | .619 | 8 | .615 |
|---|
| 2nd | 6 | 20 | .300 | 5 | 16 | .313 | 1 | 4 | .250 | .325 | 5 | .833 |
|---|
| 3rd | 6 | 14 | .429 | 4 | 10 | .400 | 2 | 4 | .500 | .500 | 5 | .833 |
|---|
| 4th | 8 | 22 | .364 | 7 | 17 | .412 | 1 | 5 | .200 | .386 | 6 | .750 |
|---|
| Tot | 33 | 77 | .429 | 29 | 63 | .460 | 4 | 14 | .286 | .455 | 24 | .727 |
|---|

×
×
●
×
●
×
×
×
●
×
●
×
×
×
×
×
×
×
●
×
×
●
×
×
●
×
×
×
×
×
×
×
×
●
×
●
●
×
×
×
×
●
×
×
×
●
●
●
×
×
×
|
Toronto Raptors Table
| Qtr |
FG |
FGA |
FG% |
2P |
2PA |
2P% |
3P |
3PA |
3P% |
eFG% |
Ast'd |
%Ast'd |
| 1st | 8 | 21 | .381 | 8 | 20 | .400 | 0 | 1 | .000 | .381 | 6 | .750 |
|---|
| 2nd | 10 | 21 | .476 | 10 | 18 | .556 | 0 | 3 | .000 | .476 | 7 | .700 |
|---|
| 3rd | 9 | 20 | .450 | 6 | 15 | .400 | 3 | 5 | .600 | .525 | 5 | .556 |
|---|
| 4th | 7 | 16 | .438 | 7 | 15 | .467 | 0 | 1 | .000 | .438 | 4 | .571 |
|---|
| Tot | 34 | 78 | .436 | 31 | 68 | .456 | 3 | 10 | .300 | .455 | 22 | .647 |
|---|

×
×
×
×
●
×
×
●
×
×
●
×
●
×
×
×
×
×
×
×
●
×
×
×
●
×
●
×
×
×
×
×
●
×
●
●
×
●
×
×
×
×
●
●
×
×
×
|


